
Appendix C

Appendix C
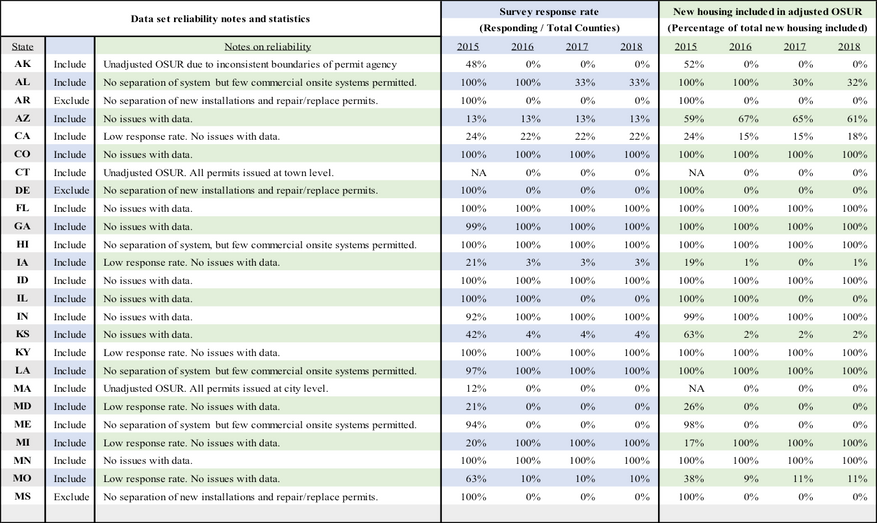
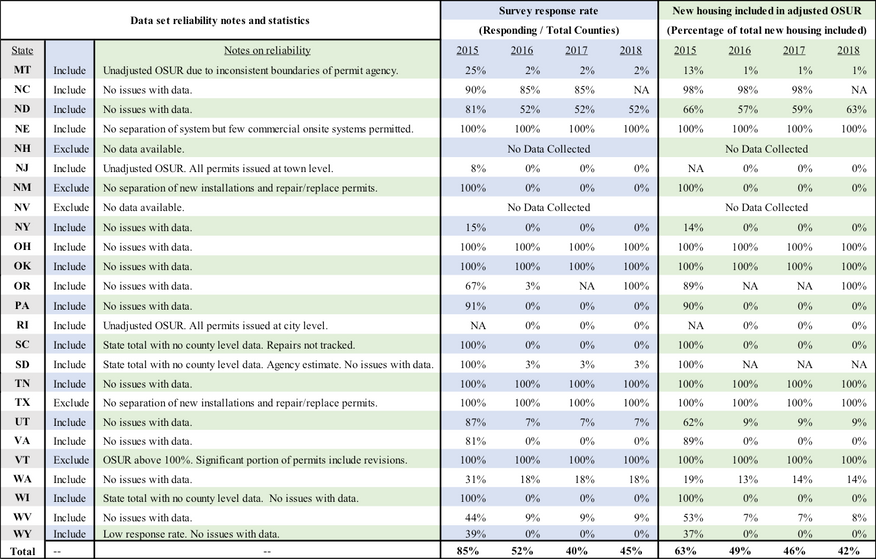
 The two tables below show state data set: a) inclusion/exclusion in adjusted national OSUR assessment, b) notes on reliability of state data set, c) survey response rate by county, and d) percentage of total new housing included for the adjusted OSUR.

Table showing state data (AK through MS) set: a) inclusion/exclusion in adjusted national OSUR assessment, b) notes on reliability of state data set, c) survey response rate by county, and d) percentage of total new housing included for the adjusted OSUR.

Table showing state data (MT through WY) set: a) inclusion/exclusion in adjusted national OSUR assessment, b) notes on reliability of state data set, c) survey response rate by county, and d) percentage of total new housing included for the adjusted OSUR.